Pediatric ECGs: A Primary Care Primer
Pediatric ECGs are regularly performed for a variety of conditions, including chest pain, syncope, and suspected arrhythmia. Correct interpretation of ECGs can be challenging when technique is faulty or when the variability of normal values in children is not taken into account.

Pediatric ECGs are regularly performed for a variety of conditions, including chest pain, syncope, and suspected arrhythmia. Correct interpretation of ECGs can be challenging when technique is faulty or when the variability of normal values in children is not taken into account (Table). Age-related variations are found in nearly all aspects of the ECG, including heart rate, axis, intervals, and voltage criteria. Normal variations are also observed in such conditions as early repolarization, sinus arrhythmia, premature beats, and sinus bradycardia of the athlete.
In this article, I review proper technique and outline a systematic approach for confident interpretation of pediatric ECGs.
TECHNIQUE
The most important component of technique is the production of an artifact-free recording. This may be a challenge in active children, because any movement can create an artifact. With movement artifacts, the baseline of the ECG becomes erratic and it is difficult to determine where the QRS complexes are. In our practice, we use cartoons, movies, stickers, and bubbles as distractions. Because the ECG can be completed relatively quickly, these usually suffice.
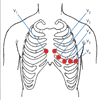
Next most important is placement of the electrodes. Some pediatric cardiology clinics use a 15-lead system (which includes leads V3R, V4R, and V7). In the primary care setting, the 12-lead ECG system, which records data from 9 surface areas on the supine body (Figure 1), is adequate.
Finally, the ECG should be recorded at a standard 25 meters per second with full standard voltage set at 1.0 mV/10 mm.1

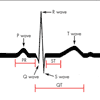
A complete electrographic heart cycle is illustrated in Figure 2. It may be summarized as follows:
The P wave, the first deflection of a cardiac cycle, correlates with atrial contraction.
The PR interval represents the time it takes the impulse to go through the antrioventricular (AV) node.
The QRS complex represents ventricular depolarization.
The ST segment correlates with the plateau or initial phase of ventricular repolarization.
The T wave represents ventricular repolarization.
The QT segment, which includes the QRS complex and the T wave, correlates with complete ventricular systole.

A SYSTEMATIC APPROACH
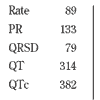
First, note whether the ECG was recorded at full standard voltage. Then note the age of the child (Figure 3). Without this information, misinterpretation is possible.
Interpretation of an ECG is descriptive. Describe what you see and the diagnosis will become evident. Always read ECGs from left to right. A systematic approach helps distinguish between normal and abnormal findings and is less likely to result in error.
P wave. Check the P wave axis, morphology, and size. The axis is normal when the P wave is positive in leads I, II, and aVF. The rhythm is sinus if the P wave axis is normal, if every P wave is followed by a QRS complex, and if every QRS complex is preceded by a P wave. When the impulse is generated outside the sinus node, the P wave axis is abnormal; this is known as ectopic atrial rhythm. The morphology of the P wave can provide subtle hints about whether the rhythm was generated outside the sinus node. The size and morphology of the P wave can also suggest atrial enlargement. If the amplitude and duration are greater than normal pediatric values in lead II or double-humped/biphasic in lead VI, the atria may be enlarged.1
PR interval. This segment provides clues about the functioning of the AV node. Short PR intervals are sometimes associated with tachyarrhythmias; long PR intervals may suggest bradyarrhythmias.
QRS complex. Check the axis, morphology, and size. Determine the axis by observing the deflection in leads I and aVF. The axis is normally rightward in the neonate until ventricular remodeling produces left ventricular dominance. Thus, in infants, the normal QRS deflection is negative in lead I and positive in lead aVF. In children past infancy, the normal QRS is positive in leads I and aVF.
Next, check the morphology and size of the QRS. The normal conduction pathway always produces similar-looking QRS complexes. If the morphology changes, it is likely that the pathway is not through the normal conduction system. The normal QRS is narrow, although the exact duration is age-dependent. A QRS interval that is wider than normal suggests a ventricular conduction delay.
Although cardiac infarction is extremely rare in children, a deep, wide Q wave may suggest this condition. A significant Q wave is either wider than 1 small box (40 milliseconds) or longer than one third of the entire amplitude of the QRS complex. The pattern of infarction is similar to that found on an adult ECG: significant Q waves in leads II, III, and aVF suggest an inferior infarction; in leads I and aVL, they indicate a lateral infarction; and in leads V1 through V4, they represent an anterior infarction. Q waves in lead aVR do not reliably indicate infarction.
QRS amplitude can also be used to screen for ventricular hypertrophy. Right ventricular hypertrophy is suggested when the R wave in V1 and/or S wave in V6 is larger than normal for the child's age, when there is a pure R in V1, qR in V1, or rSR9 in V1. Suspect left ventricular hypertrophy when the S wave in V1 and/or the R wave in V6 is larger than normal for the child's age.
The QRS (specifically, the R-R interval) can also be used to determine heart rate. This is done the same way as for an adult ECG, with the caveat that normal resting heart values are faster in younger patients.
ST segment. Elevation in the ST segment can signify myocardial strain or infarction; however, infarction in children is more likely the result of abnormal congenital coronary anatomy. ST elevation is more commonly associated with pericarditis and tends to be diffuse in this setting. ST depression, on the other hand, may be seen in children with perfusion deficits to the myocardium.
T wave. In infants and very young children, inverted T waves in V1 through V3 and even V4 are completely normal. An upright T wave in the newborn may suggest right ventricular hypertrophy. As the child grows, the T wave will become upright in sequence from the lateral chest leads (V4) to the anterior chest leads (V1). The inverted T wave in V1 through V3 is seen into adolescence.
QT interval. The corrected QT interval (QTc) is used in pediatric ECGs. This is obtained with the Bazett formula (QTc equals QT in seconds divided by the square root of R-R in seconds) and used to correct for the faster resting heart rate in children. It is important to evaluate this interval because a prolonged QT interval is associated with long QT syndrome. In children younger than 6 months, the normal QTc interval is less than 450 milliseconds; in children older than 6 months, it is less than 440 milliseconds. More recently, malignant arrhythmias have been reported in children with a shortened QTc interval (ie, shorter than 300 milliseconds).2-6
"NORMAL" ABNORMALITIES IN CHILDREN
A number of ECG "abnormalities" in children are considered clinically insignificant.
Early repolarization. This is defined as minimal ST elevation in the lateral chest leads (see Figure 3). This is a normal finding, seen most commonly in athletic male adolescents.7
Premature contractions. These are occasional beats firing from outside the sinus node before the sinus node fires. Premature beats can arise from anywhere in the heart, including the atrium (PACs), junction, and ventricle (PVCs). Although premature contractions are found in all age groups, PACs are seen most commonly in neonates and are considered normal. Benign premature beats occur occasionally, are of similar morphology in the same patient, and usually do not occur in runs. PVCs are differentiated from PACs by morphology: the QRS interval of a PVC is usually longer than 90 milliseconds, while the QRS interval of a PAC is less than 90 milliseconds.
Sinus arrhythmia.This common finding is an irregular rhythm with respiratory variation in the heart rate (see Figure 3). The heart beats slightly faster or slightly slower based on the respiratory cycle. The rhythm arises from the sinus node, so all the characteristics of sinus rhythm pertain to this rhythm. Sinus arrhythmia is considered normal even when quite profound.
Sinus bradycardia of the athlete. Sinus bradycardia, even with a heartbeat as low as the high 40s to 50 beats per minute, is considered normal in well-trained adolescent athletes (under 60 beats per minute is considered bradycardia). This is a regular rhythm that arises from the sinus node, so all the characteristics of sinus rhythm apply to this rhythm as well. For sinus bradycardia to be considered a normal variation, the child should have no symptoms of bradycardia (eg, fatigue, light-headedness, exercise intolerance, or presyncope). This rhythm is usually found incidentally.
COMPUTER INTERPRETATION
Although computers may accurately interpret normal ECGs, misreading has been a problem in pediatric-specific programs. In a recent 12-month study of ECG interpretation in a pediatric emergency department (ED), the computer correctly identified 100% of normal ECGs, 75% of ECGs with minimal or indeterminate clinical significance, and 14% of ECGs with clinical significance.8 In comparison, the ED physicians scored 100%, 36%, and 28%, respectively. Although misinterpretation of a clinically significant abnormality can have disastrous consequences, "overreading" abnormalities when they are in fact normal variants or artifacts may create unnecessary anxiety.
Some pediatric software programs are better than others, but in my opinion none can replace a caregiver who is skilled in pediatric ECG interpretation.
References:
REFERENCES:
1.
Van Hare GF, Dubin AM. The normal electrocardiogram. In: Hugh AD, Gutgesell HP, Clark EB, Driscoll DJ, eds.
Moss and Adams' Heart Disease in Infants, Children, and Adolescents: Including the Fetus and Young Adult.
6th ed. Philadelphia: Lippincott, Williams & Wilkins; 2001:425-442.
2.
Schwartz PJ, Moss AJ, Vincent GM, Crampton RS. Diagnostic criteria for the long QT syndrome. An update.
Circulation.
1993;88:782-784.
3.
Moss AJ. Long QT syndrome.
JAMA.
2003;289: 2041-2044.
4. Zipes DP, Ackerman MJ, Estes NA 3rd, et al. Task Force 7: arrhythmias. J Am Coll Cardiol. 2005; 45:1354-1363.
5. Brugada R, Hong K, Dumaine R, et al. Sudden death associated with short-QT syndrome linked to mutations in HERG. Circulation. 2004;109:30-35.
6. Gaita F, Giustetto C, Bianchi F, et al. Short QT syndrome. Circulation. 2003;108:965-970.
7. Dubin D. Rapid Interpretation of ECGs: An Interactive Course. Tampa, Fla: Cover Publishing Co; 2000.
8. Snyder CS, Fenrich AL, Friedman RA, et al. The emergency department versus the computer: which is the better electrocardiographer? Pediatr Cardiol. 2003;24:364-368.
9. Davignon A, Rautaharju P, Boisselle E, et al. Normal ECG standards for infants and children. Pediatr Cardiol. 1979;1:123-152.